Household income or consumption by percentage share - lowest 10% (%) 2018 Country Ranks, by Rank
SOURCE: CIA World Factbook 2018

| | GEOGRAPHY | GEOLOGY | USA STATISTICS | CHINA STATISTICS | COUNTRY CODES | AIRPORT CODES | RELIGION | JOBS | |
|
||
|
||
|
|
||
|
Household income or consumption by percentage share - lowest 10% (%) 2018 Country Ranks, by Rank SOURCE: CIA World Factbook 2018 |
||
|
|
||

Custom Search

|
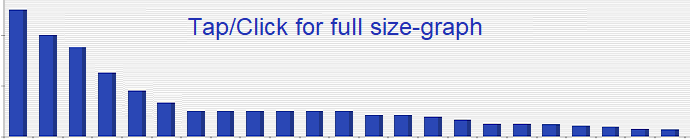
Household income or consumption by percentage share - lowest 10% (%) 2018 Country Ranks, by Rank


NOTE: The information regarding Household income or consumption by percentage share - lowest 10% (%) on this page is re-published from the CIA World Factbook 2018. No claims are made regarding the accuracy of Household income or consumption by percentage share - lowest 10% (%) information contained here. All suggestions for corrections of any errors about Household income or consumption by percentage share - lowest 10% (%) should be addressed to the CIA.

SOURCE: CIA World Factbook 2018 This page was last modified 23-Jul-18 Copyright © ITA (all rights reserved). 

|
|
|||||||||||||||||||||||||||||||||||||||||||||||||||||||||||||||||||||||||||||||||||||||||||||||||||||||||||||||||||||||||||||||||||||||||||||||||||||||||||||||||||||||||||||||||||||||||||||||||||||||||||||||||||||||||||||||||||||||||||||||||||||||||||||||||||||||||||||||||||||||||||||||||||||||||||||||||||||||||||||||||||||||||||||||||||||||||||||||||||||||||||||||||||||||||||||||||||||||||||||||||||||||||||||||||||||||||||||||||||||||||||||||||||||||||||||||||||||||||||||||||||||||||||||||||||||||||||||||||||||||||||||||||||||||||||||||||||||||||||||||||||||||||||||||||||||||||||||||||||||||||||||||||||||||||||||||||||||||||||||||||||||||||||||||||||||||||||||||||||||||||||||||||||||||||||||||||||||||||||||||||||||||||||||||||||||||||||||||||||||||||||||||||||||||||||||||||||||||||||||||||||||||||||||||||||||||||||||||||||||||||||||||||||||||||||||||||||||||||||||||||||||||||||||||||||||||||||||