| GEOGRAPHY | GEOLOGY | USA STATISTICS | CHINA STATISTICS | COUNTRY CODES | AIRPORT CODES | RELIGION | JOBS |

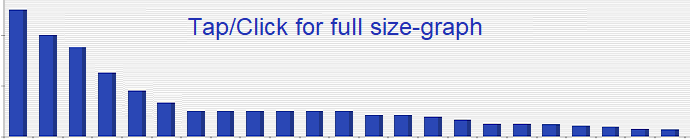
Taxes and other revenues 2019 Country Ranks, by Rank

SOURCE: CIA World Factbook 2019

Custom Search

GEOGRAPHICAL NAMES Spanish Simplified Chinese French German Russian Hindi Arabic Portuguese

Taxes and other revenues 2019 Country Ranks, by Rank

List in alphabetical order
View this list in alphabetical order View this list in Alphabetic order View this list in alphabetical order
Rank Country Value Date of Info


1   Tuvalu106.7% 2013
2   Nauru90.3% 2017
3   Greenland77.4% 2016
4   Kiribati76.8% 2017
5   Andorra69% of GDP
6   Palau66.1% 2016
7   Micronesia, Federated States Of65.2% 12/13
8   Cuba58.1% 2017
9   Norway54.4% 2017
10   France53.8% 2017
11   Finland53.1% 2017
12   Denmark53% 2017
13   Marshall Islands52.6% 2013
14   Libya51.6% 2017
15   Belgium51.3% 2017
16   Sweden50.6% 2017
17   Greece48.8% 2017
18   Austria48.3% 2017
19   Anguilla46.7% 2017
20   Italy46.6% 2017
21   Croatia46.1% 2017
22   European Union45.2% of GDP
23   Germany45% 2017
24   Hungary44.5% 2017
25   Luxembourg44.4% 2017
26   Venezuela44.2% 2017
27   Bosnia and Herzegovina44% 2017
28   Netherlands43.4% 2017
29   Slovenia43.1% 2017
30   Portugal42.9% 2017
31   Serbia42.7% 2017
32   Iceland42.4% 2017
33   Kuwait41.8% 2017
34   Solomon Islands41% 2017
35   Dominica40.9% 2017
36   Belarus40.7% 2017
37   San Marino40.6% 2011
38   Czechia40.5% 2017
39   Malta40.4% 2017
40   Estonia39.9% 2017
40   Cyprus39.9% 2017
40   Bolivia39.9% 2017
41   Tonga39.8% 2017
42   Lesotho39.7% 2017
43   Seychelles39.6% 2017
44   Poland39.5% 2017
45   French Polynesia39.4% of GDP
45   Slovakia39.4% 2017
46   Canada39.3% 2017
47   United Kingdom39.1% 2017
48   Cayman Islands38.9% 2017
48   British Virgin Islands38.9% 2017
49   Spain37.9% 2017
50   American Samoa37.8% 2016
51   Latvia37.5% 2017
52   Montenegro37.2% 2017
53   New Zealand36.8% 2017
54   Brazil35.7% 2017
54   Iraq35.7% 2017
54   Bulgaria35.7% 2017
54   Switzerland35.7% 2017
55   Australia35.5% 2017
56   Djibouti35.3% 2017
57   Japan35.2% 2017
58   Eritrea34.9% 2017
59   Lithuania33.7% 2017
60   Falkland Islands (Islas Malvinas)32.5% of GDP
61   Algeria32.3% 2017
62   Namibia32.2% 2017
63   Ecuador32% 2017
64   Saint Kitts and Nevis31.9% 2017
65   Tajikistan31.8% 2017
66   Northern Mariana Islands31.4% 2016
67   Oman31.3% 2017
68   Uzbekistan31.2% 2017
69   Botswana30.5% 2017
70   Faroe Islands30.2% 2014
70   Moldova30.2% 2017
71   Belize29.9% 2017
72   Uruguay29.8% 2017
73   Fiji29.7% 2017
73   Jamaica29.7% 2017
74   Barbados29.4% 2017
75   Angola29.3% 2017
75   Romania29.3% 2017
76   Macau29.2% 2017
77   Macedonia29% 2017
77   Cook Islands29% 2010
77   Kosovo29% 2017
78   Virgin Islands28.9% 2016
79   United Arab Emirates28.8% 2017
80   Georgia28.7% 2017
80   Saint Vincent and the Grenadines28.7% 2017
80   Kyrgyzstan28.7% 2017
81   Eswatini28.6% 2017
82   Samoa28.2% 2017
83   Guyana28.1% 2017
84   Nicaragua28% 2017
85   Cabo Verde27.8% 2017
86   Albania27.6% 2017
87   Mauritania27.4% 2017
88   Vanuatu27.2% 2017
88   Bhutan27.2% 2017
89   Peru27.1% 2017
90   Saint Pierre and Miquelon26.8% 96
91   Mozambique26.7% 2017
92   Mongolia26.6% 2017
92   Ukraine26.6% 2017
92   South Africa26.6% 2017
93   Israel26.5% 2017
93   Colombia26.5% 2017
94   Saudi Arabia26.4% 2017
94   Qatar26.4% 2017
94   Maldives26.4% 2016
95   Sao Tome and Principe26.2% 2017
96   Ireland26% 2017
97   Grenada25.8% 2017
98   Comoros25.3% 2017
99   Aruba25.2% 2017
100   Vietnam24.8% 2017
101   Tunisia24.7% 2017
102   Trinidad and Tobago24.5% 2017
103   Nepal23.8% 2017
104   El Salvador23.7% 2017
105   Jordan23.6% 2017
105   Saint Lucia23.6% 2017
106   Azerbaijan23.5% 2017
107   Gibraltar23.3% 2008
108   Hong Kong23.2% 2017
108   Korea, South23.2% 2017
109   Armenia22.9% 2017
110   Mexico22.7% 2017
111   Mauritius22.5% 2017
111   Congo, Republic Of The22.5% 2017
112   Kazakhstan22.3% 2017
113   Malawi21.7% 2017
114   Lebanon21.5% 2017
114   Zimbabwe21.5% 2017
114   Togo21.5% 2017
115   Guam21.4% 2016
115   Niger21.4% 2017
116   Rwanda21.3% 2017
116   China21.3% 2017
117   Burkina Faso21.2% 2017
118   Morocco20.9% 2017
119   Chile20.8% 2017
120   Guernsey20.6% of GDP
121   New Caledonia20.4% 2015
122   Turkey20.3% 2017
122   Gambia, The20.3% 2017
122   Ghana20.3% 2017
122   Honduras20.3% 2017
123   Panama20.1% 2017
124   Mali20% 2017
125   Senegal19.6% 2017
125   Antigua and Barbuda19.6% 2017
126   Argentina18.9% 2017
127   Brunei18.5% 2017
127   Sudan18.5% 2017
128   Papua New Guinea18.4% 2017
129   Laos18.3% 2017
130   Guinea-Bissau18.2% 2017
130   Haiti18.2% 2017
131   Cambodia17.9% 2017
131   Egypt17.9% 2017
132   Gabon17.6% 2017
132   Kenya17.6% 2017
132   Bahamas, The17.6% 2017
133   Zambia17.4% 2017
134   Iran17.3% 2017
135   Benin17.1% 2017
136   United States17% 2017
137   Equatorial Guinea16.9% 2017
137   Liberia16.9% 2017
138   Wallis and Futuna16.7% 2015
139   Jersey16.6% of GDP
139   Bahrain16.6% 2017
139   Guinea16.6% 2017
140   Malaysia16.4% 2017
140   Russia16.4% 2017
140   Suriname16.4% 2017
141   Bermuda16.3% 2017
142   Taiwan16% 2017
143   Madagascar15.9% 2017
144   Burundi15.8% 2017
145   Singapore15.7% 2017
146   Philippines15.6% 2017
146   Sierra Leone15.6% 2017
147   Pakistan15.4% 2017
148   Cameroon15.3% 2017
149   Tanzania15.2% 2017
149   Thailand15.2% 2017
150   Dominican Republic14.9% 2017
150   Monaco14.9% 2011
150   Turkmenistan14.9% 2017
150   Liechtenstein14.9% 2012
151   Central African Republic14.6% 2017
152   Uganda14.5% 2017
153   Costa Rica14.3% 2017
154   Paraguay14.2% 2017
154   Isle Of Man14.2% 05/06
155   Ethiopia13.9% 2017
156   Sri Lanka13.8% 2017
157   Burma13.5% 2017
157   Chad13.5% 2017
158   West Bank13.4% 2017
159   Indonesia13% 2017
160   Korea, North11.4% 2007
161   Congo, Democratic Republic Of The11.2% 2017
161   Afghanistan11.2% 2017
162   Guatemala10.8% 2017
162   Timor-Leste10.8% 2017
163   Bangladesh9.6% 2017
164   India9.2% 2017
165   Yemen9% 2017
166   Puerto Rico8.9% 2017
167   South Sudan8.5% 2017/18
168   Syria4.2% 2017
169   Nigeria3.4% 2017
170   Somalia2.1% 2014


NOTE: The information regarding Taxes and other revenues on this page is re-published from the CIA World Factbook 2019. No claims are made regarding the accuracy of Taxes and other revenues information contained here. All suggestions for corrections of any errors about Taxes and other revenues should be addressed to the CIA.


SOURCE: CIA World Factbook 2019
This page was last modified 18-Feb-19
Copyright © ITA (all rights reserved).


Support Our Sponsor

Support Our Sponsor